Critical infrastructure · Latin America
Ulmo Grid · by Tirion Systems
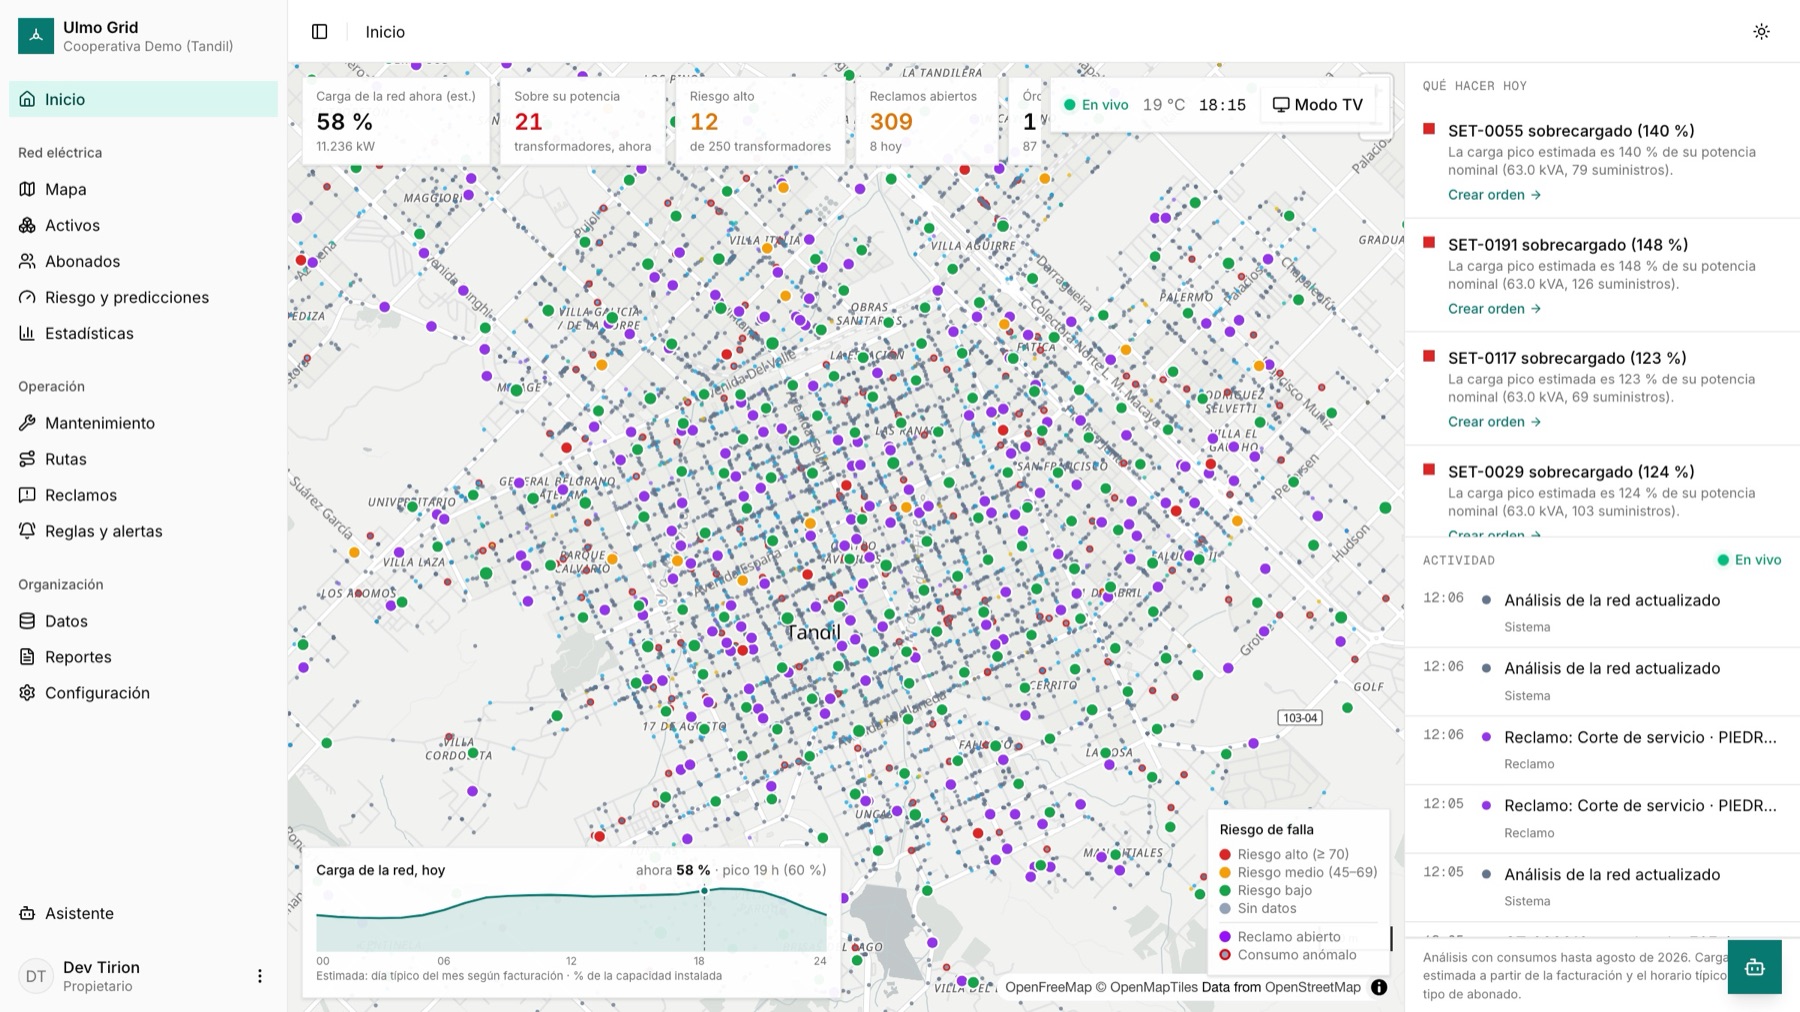
We start with the electric grid. Ulmo Grid turns the data a utility already has into inspection priorities, organized complaints and coordinated field work.
No servers or sensors needed to start. When you're ready, add measurements on the assets where they matter most.
Cooperatives and utilities know their networks. But complaints, consumption, assets and field work live in separate systems, spreadsheets and chat threads. So problems surface only when they're already urgent.
They come in by phone or at the counter, and aren't always tied to the asset that serves that customer.
The asset inventory and billing data exist, but nobody cross-references them to see which transformer is under the most stress.
Site visits and work orders are coordinated over chat, and results are barely recorded.
What we build
Latin America's cooperatives, utilities and public service providers keep power and water flowing for millions of people. Ulmo Grid is the shared system where those networks are seen, prioritized and operated: one model for their assets, customers, complaints and field work.
We start with electricity distribution. The same foundation later extends to water and waste.
How it fits together
Customer registry, billed consumption, transformer inventory and complaints, exactly as they come out of your systems.
Every service point linked to its transformer on one map. You always see where each link comes from, and you can correct it.
Priority assets with their reasons, grouped complaints, work orders, routes and reports.
Sensors on the assets where they matter most. Measurements replace estimates without instrumenting the whole network.
How it works
Estimated load
We estimate each transformer's load from billing data and typical hourly profiles, and build the inspection priorities.
Measured load
On instrumented assets, measurements replace estimates. There's no need to instrument the whole network.

From complaint to inspection · illustrative case
By service point number or address. Each one lands on the map.
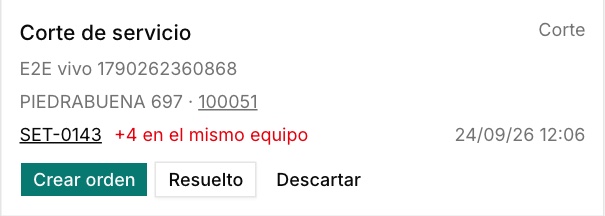
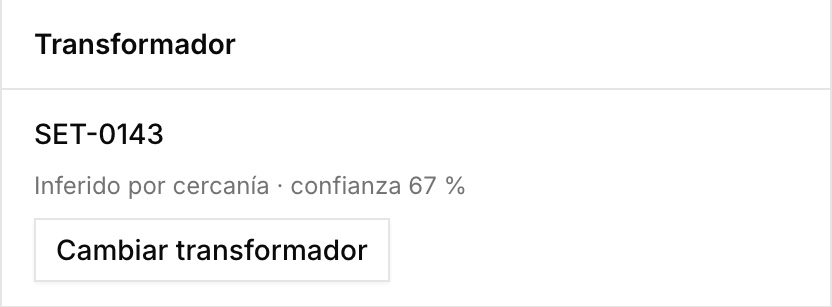
From the billing code, a manual assignment or proximity, with a confidence level.
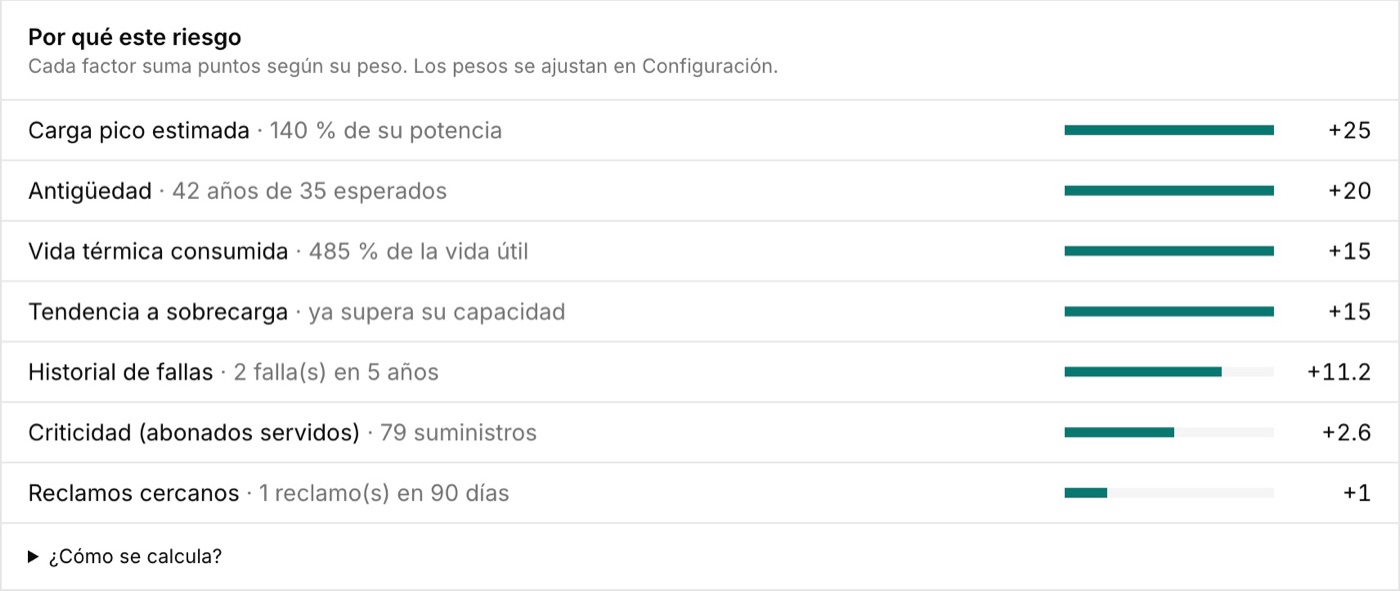
Each factor adds points, so you see why that asset comes first. The work order starts there.
The work order gets a crew and a date. Findings go into the asset's history.
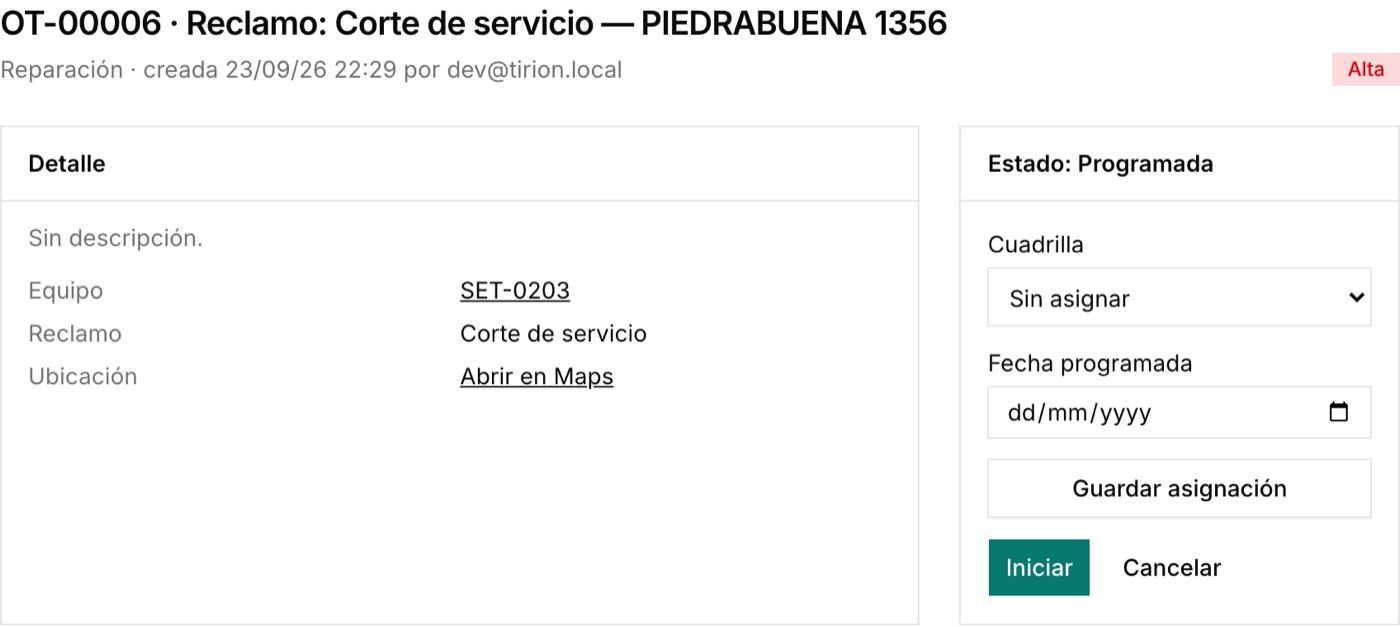
Screenshots with demo data.
For every team
Which problems need attention, and the evidence to back up priorities.
Which assets to inspect first, and why.
How to organize complaints, site visits and pending work.
Clear information to support maintenance and investment decisions.
Get started
Browser-based, no servers to install. Files come in Excel or CSV, straight from your billing system.
We'll review a sample of your data together to confirm what can be loaded.